Singapore ranks as the world’s most expensive city and Asia seems to resurge in the Worldwide Cost of Living Survey of 2017.
How much does living cost?
Although it may read like and existential question, there is a cost for living in the world’s cities.
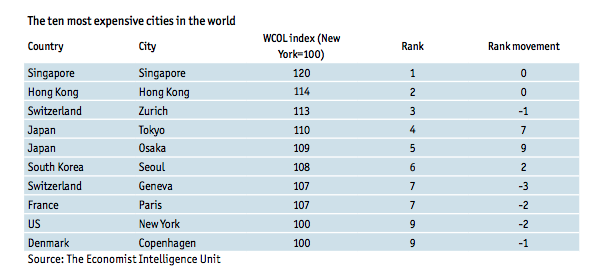
During 2017, according to the Worldwide Cost of Living Survey, conducted by the Economist Intelligence Unit, Singapore ranks as the world’s most expensive city for a fourth consecutive year.
Asian cities seems to resurge as 4 out of 5 cities lead the top 5: Hong Kong, Tokyo and Osaka, alongside with Singapore, have become comparatively more expensive.
On the other side, Zurich is the most expensive city in Europe and New York is the sole North American city in the top ten as it has fallen to ninth owing to a slight weakening of the US dollar, which has also affected the position of other US cities in the rank.
Brazilian cities like São Paulo and Rio de Janeiro are the fastest–rising cities in the cost of living ranking, while the devaluation of the Argentinian peso put Buenos Aires in the 82nd place of the ranking, down 20 positions.
Seeing a sharp increase in cost, what to expect now?
The relative cost of living has sharply increased over the past 5 years, as living in Paris, France is 7% more expensive than living in New York, however, 5 years ago it was 50% pricier.
Deflation, devaluations, currency weakening and the fall of local prices have been prominent factors in elevating the cost of living, which is always changing and already facing indications of further changes that are set to take place during the coming year.
2018 is set to experience a volatile change as considerable blows on prices and markets will rock local economies and their controls causing austerity and depressing consumer sentiment and growth.
Conflict and instability caused by political tensions aim to push up prices for imports and exports around the world as treaties unravel under scrutiny.
About the survey
The Worldwide Cost of Living is a bi-annual Economist Intelligence Unit survey.
It compares more than 400 individual prices across 160 products and services such as food, drink, clothing, household supplies and personal care items, home rents, transport, utility bills, private schools, domestic help and recreational costs.
These are the hardest working cities in the U.S.