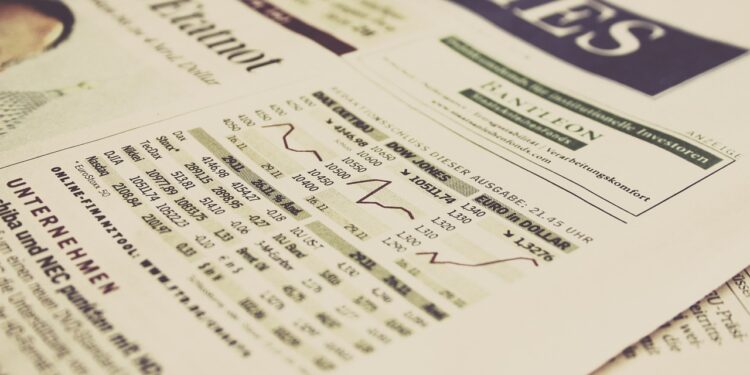
There is a debate around whether or not US’ stock valuations have seen their zenith.
How long can a bull run? It seems to be the question in many an analyst mind as the current upside trend in US stocks’ prices stretches beyond the 100-month mark and some similarities with the 1990-to-2000 dot-com bubble draw attention to its possible outcome.
Since March 6, 2009, the Dow Jones Industrial average (DJI) has climbed over 242% in an eight and a half year-long rally that has been reported as the second largest in modern US history, precisely after the dot-com euphoria of the late 20th century. That one lasted around 113 months and reached gains of over 400% before coming to a hard crash.
“There are clear similarities between the current state of the market and the tech boom of 2000. Like that era, the market is being driven by tech companies, such as Amazon and Apple,” says Katherine Denham of website City AM.
CNN Money ran a story on Oct. 4 remembering readers that “there are plenty of risks, of course. Stocks don’t go up forever. There is always the chance of what stock market pros call ‘an exogenous shock’ — an unpredictable factor that roils markets. And there is a long list of known risks around the world: North Korea, Brexit, a slowdown in the global economy.”
“To match the epic market run from 1987 to 2000, stocks would almost have to double from here, and run almost four more years,” CNN Money adds.
Dow Jones Industrial Average
MARCH 6, 2009 6,626.94
OCTOBER 4, 2017 22,670.09


