Tuesday, June 24, 2025
  • Login
CEO North America
  • Home
  • News
    • Business
    • Entrepreneur
    • Industry
    • Innovation
    • Management & Leadership
  • CEO Interviews
  • Opinion
  • Technology
  • Environment
  • CEO Life
    • Art & Culture
    • Food
    • Health
    • Travel
No Result
View All Result
  • Home
  • News
    • Business
    • Entrepreneur
    • Industry
    • Innovation
    • Management & Leadership
  • CEO Interviews
  • Opinion
  • Technology
  • Environment
  • CEO Life
    • Art & Culture
    • Food
    • Health
    • Travel
No Result
View All Result
CEO North America
No Result
View All Result

CEO North America > Business > Supply, Demand, and Inflation: The Big Picture

Supply, Demand, and Inflation: The Big Picture

in Business
Supply, Demand, and Inflation: The Big Picture
Share on LinkedinShare on WhatsApp

Thankfully, inflation is slowing down. Prices rose only 0.1 percent in November, yielding the lowest annualized inflation rate (7.1 percent) in a year. Core inflation, which excludes volatile food and energy prices, rose 0.2 percent (6.0 percent annual). While it’s too soon to celebrate, there’s hope for continued disinflation.

Let’s take a look back. Where did all this inflation come from? There are two broad possibilities. The first is expansive aggregate demand (loose money). The second is flagging aggregate supply (productivity problems). A big-picture analysis shows that both matter, but demand matters more.

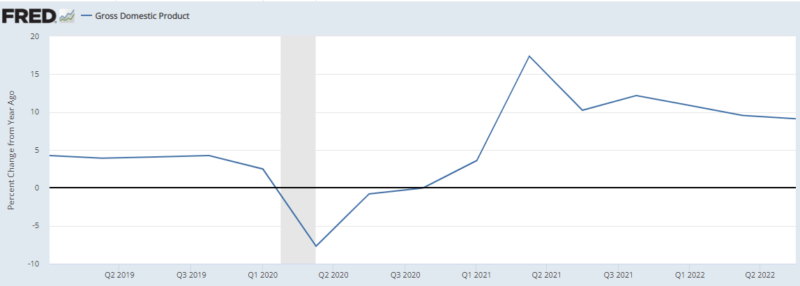
Remember, aggregate demand comes from the dynamic version of the equation of exchange: growth in effective monetary expenditures (gM+gV) must equal growth in nominal GDP (gP+gY). Before COVID, we were on a steady nominal GDP (NGDP) growth path of 5 percent per year. After the COVID shock, nominal spending growth increased to approximately 10 percent per year. Aggregate demand is obviously elevated. But what’s going on under the hood?

Figure 1: NGDP

- Supply, Demand, and Inflation: The Big Picture

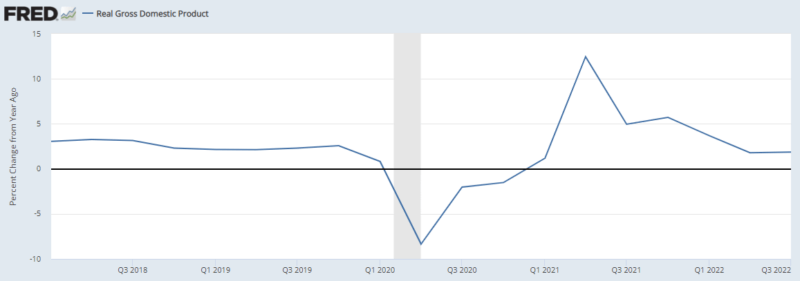
When checking real (inflation-adjusted) GDP, we see a similar pattern to NGDP. Pre-COVID, the economy’s growth path was somewhere between 2.5 and 3 percent. The post-COVID equilibrium ranges from 1.7 and 2.0 percent. At most, that’s 1.3 percent per year lower in real income growth. Let’s assume the dropoff can be explained entirely by productivity problems, such as supply-chain issues. That means supply-side woes are adding 1.3 percent to inflation. That’s not trivial, but neither is it the lion’s share.

Figure 2: RGDP

- Supply, Demand, and Inflation: The Big Picture

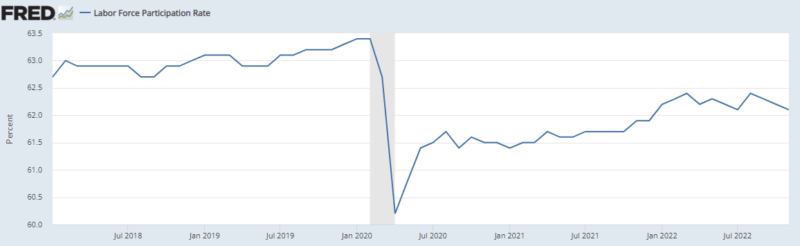
Unemployment is perhaps the strangest indicator. Before COVID, the unemployment rate was very low, at 3.6 percent. After the COVID craziness, it increased to…3.7 percent, which is also very low! Despite lackluster growth, the US economy appears close to full employment. There’s a complicating factor, however: labor force participation permanently declined after COVID, partly due to generous government transfer payments.

Getting back to supply and demand, we can easily have full employment and surging inflation if aggregate demand is too high. It’s harder to see how this can work if the cause is low aggregate supply. You’d expect diminished productivity to cause an uptick to unemployment. That hasn’t been the case so far.

Figure 3: Unemployment

- Supply, Demand, and Inflation: The Big Picture

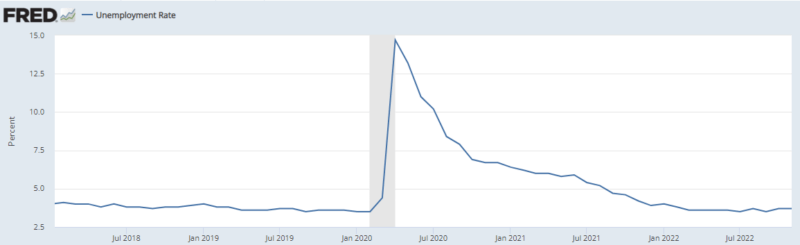
Figure 4: Labor Force Participation

- Supply, Demand, and Inflation: The Big Picture

Now let’s consider productivity. The best measure is probably total factor productivity, but this data series hasn’t been updated for the COVID and post-COVID years. Instead, we’ll look at labor productivity, in terms of output per hour. (We’re measuring averages here, not marginal contributions.) Perhaps counterintuitively, productivity spikes during COVID. This actually makes economic sense. Many fewer workers were working. If businesses sent home the least productive workers first, as one might expect, those that remained would tend to have a higher average level of productivity. 

Figure 5: Average Labor Productivity

- Supply, Demand, and Inflation: The Big Picture

Before COVID, labor productivity grew between 1 and 3 percent per year. Since then, it’s fluctuated much more widely, frequently venturing into negative territory. The average over the past eight quarters is -0.68 percent. The most recent figure, Q32022, is back into positive territory (0.8 percent). This reinforces a partial productivity story. 

Supply-side issues are a problem, but in terms of magnitudes, it just doesn’t make sense to call them the chief contributor.

Courtesy American Institute for Economic Research. By Alexander William Salter. Article available here.

Tags: economic researchinflationsupply and demand

Related Posts

Ford’s Peter Stern joins Peloton as new CEO
Business

Ford’s Peter Stern joins Peloton as new CEO

JP Morgan begins lawsuits against customers
Business

JP Morgan begins lawsuits against customers

Tapestry’s $8.5 billion acquisition of Capri blocked by Judge
Business

Tapestry’s $8.5 billion acquisition of Capri blocked by Judge

McDonald’s E. coli emergency sees Yum Brands and Burger King also remove onions from restaurants
Business

McDonald’s E. coli emergency sees Yum Brands and Burger King also remove onions from restaurants

Fed Governor Bowman sees economy slowing
Business

Federal Reserve releases its Beige Book

Boeing strike continues as Union rejects new offer
Business

Boeing strike continues as Union rejects new offer

American Airlines’ mistreatment of passengers with disabilities earns them a $50 million fine
Business

American Airlines’ mistreatment of passengers with disabilities earns them a $50 million fine

Denny’s will close 150 locations
Business

Denny’s will close 150 locations

Nike renews partnership with NBA and WNBA in “much bigger” deal
Business

Nike renews partnership with NBA and WNBA in “much bigger” deal

Clean energy policies channel dollars to US agricultural sector
Industry

US Farmers are harvesting at a record pace

No Result
View All Result

Recent Posts

  • WIND & SOLAR — THE GOOD, THE CHALLENGING AND THE HOPEFUL
  • The impact of US trade policy on jobs and inflation in Canada
  • Oil prices plummet below pre-Iran-Israel conflict levels
  • Jensen Huang kicks off Nvidia stock offload plan
  • Iberdrola seeks U.S. expansion, appoints Pedro Azagra as new CEO

Archives

Categories

  • Art & Culture
  • Business
  • CEO Interviews
  • CEO Life
  • Editor´s Choice
  • Entrepreneur
  • Environment
  • Food
  • Health
  • Highlights
  • Industry
  • Innovation
  • Issues
  • Management & Leadership
  • News
  • Opinion
  • PrimeZone
  • Printed Version
  • Technology
  • Travel
  • Uncategorized

Meta

  • Log in
  • Entries feed
  • Comments feed
  • WordPress.org

  • CONTACT
  • GENERAL ENQUIRIES
  • ADVERTISING
  • MEDIA KIT
  • DIRECTORY
  • TERMS AND CONDITIONS

Advertising –
advertising@ceo-na.com

110 Wall St.,
3rd Floor
New York, NY.
10005
USA
+1 212 432 5800

Avenida Chapultepec 480,
Floor 11
Mexico City
06700
MEXICO

  • News
  • CEO Interviews
  • Opinion
  • Technology
  • Environment
  • CEO Life

  • CONTACT
  • GENERAL ENQUIRIES
  • ADVERTISING
  • MEDIA KIT
  • DIRECTORY
  • TERMS AND CONDITIONS

Advertising –
advertising@ceo-na.com

110 Wall St.,
3rd Floor
New York, NY.
10005
USA
+1 212 432 5800

Avenida Chapultepec 480,
Floor 11
Mexico City
06700
MEXICO

CEO North America © 2024 - Sitemap

Welcome Back!

Login to your account below

Forgotten Password?

Retrieve your password

Please enter your username or email address to reset your password.

Log In
No Result
View All Result
  • Home
  • News
    • Business
    • Entrepreneur
    • Industry
    • Innovation
    • Management & Leadership
  • CEO Interviews
  • Opinion
  • Technology
  • Environment
  • CEO Life
    • Art & Culture
    • Food
    • Health
    • Travel

© 2025 JNews - Premium WordPress news & magazine theme by Jegtheme.